手軽に(コマンド一行で)pandasのDataFrameから、記述統計レベルのレポートを生成できるライブラリです。
1.インストール
(参考URL)https://github.com/pandas-profiling/pandas-profiling
pip install pandas_profiling --user
私のPC環境では「–user」を入れないとエラーになりました。
(動作環境)OS: Windows 8.1、 python: 3.6.5、pandas: 0.23.0、numpy: 1.17.3、 pandas-profiling: 2.3.0
2.プロファイル作成
- 「iris.csv」ファイルの読み込み
In [1]:
# -*- coding: utf-8 -*-
import numpy as np
import pandas as pd
import pandas_profiling as pp

w_path  = 'C:/Users/N/'
df      = pd.read_csv(w_path + 'iris.csv', encoding='shift-jis', skiprows=0)
- プロファイルの作成。このコマンドだけでレポート(後述)が作成されます。
In [2]:
profile = pp.ProfileReport(df)
- プロファイルの出力
In [3]:
profile.to_file(output_file='output.html')
pandas-profiling2.3.0では 「outputfile=」ではなく「output_file=」にしないエラーになりました。
3.プロファイル(レポート)を見てみる
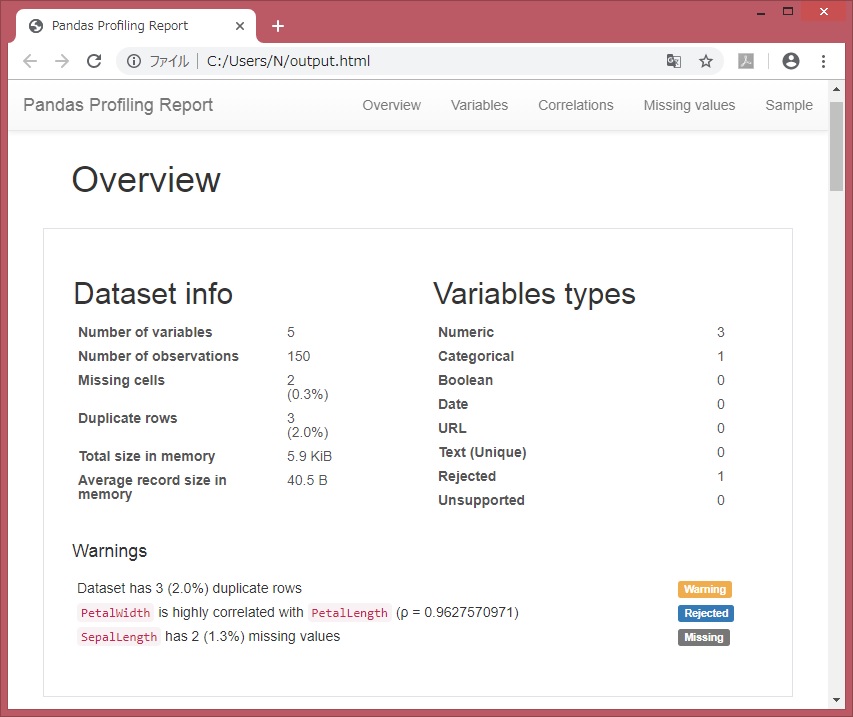
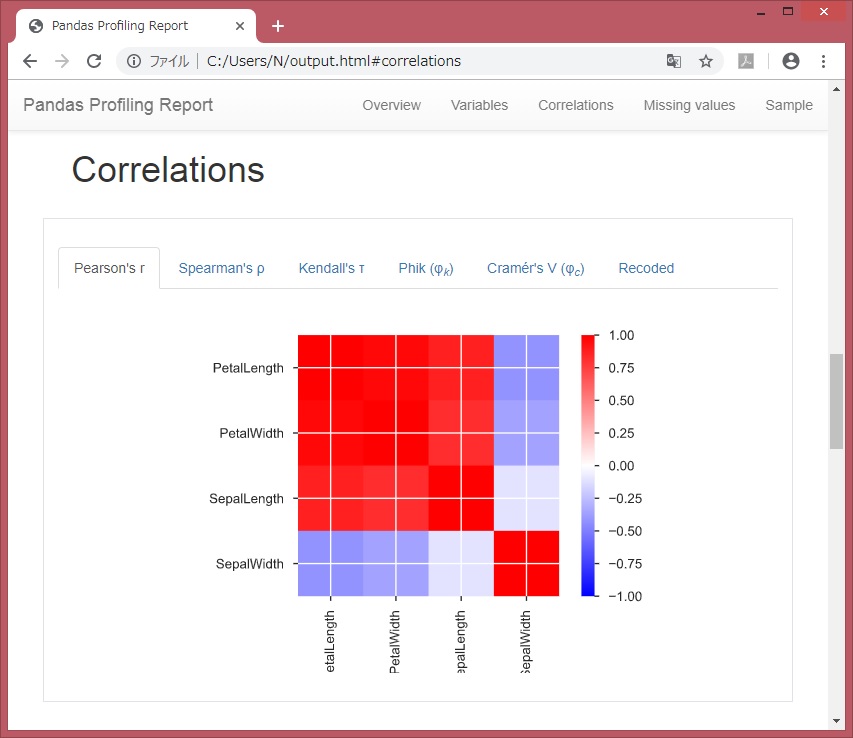
●概要:変数数、レコード数、欠損値セル数、データ型 ●変数:各変数の記述統計、ヒストグラム ●相関:ピアソン、スピアマン、ケンドール などが見れます。
概要:Overview
df.shape、df.dtypesあたりも包まれてます。
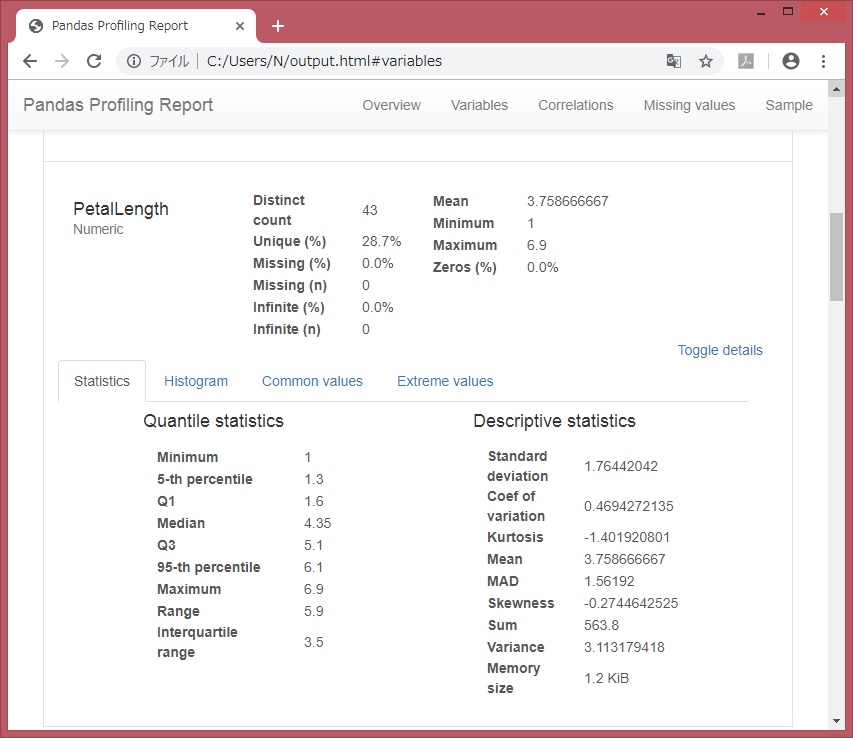
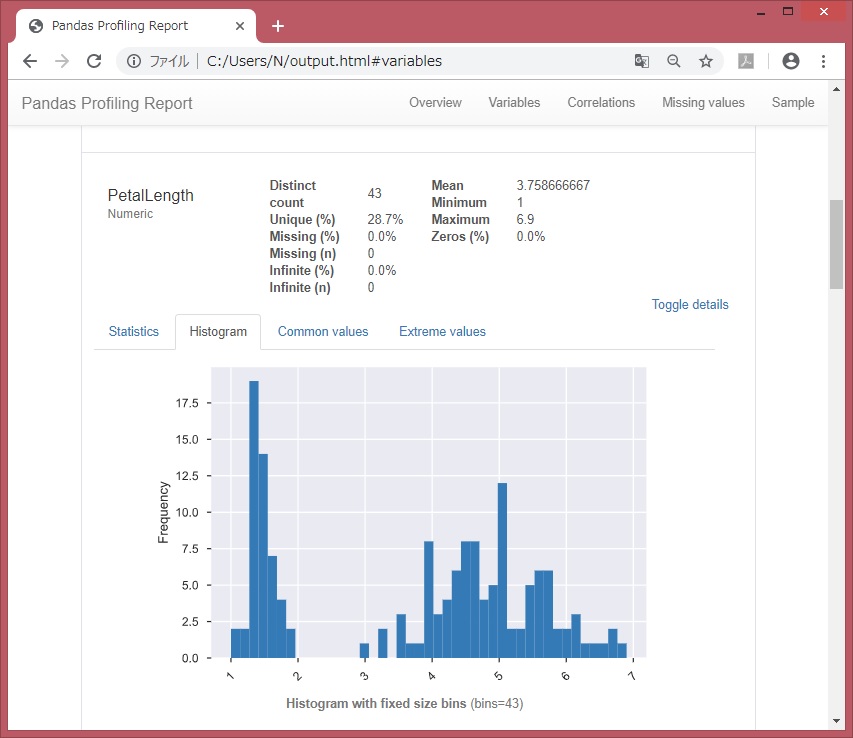
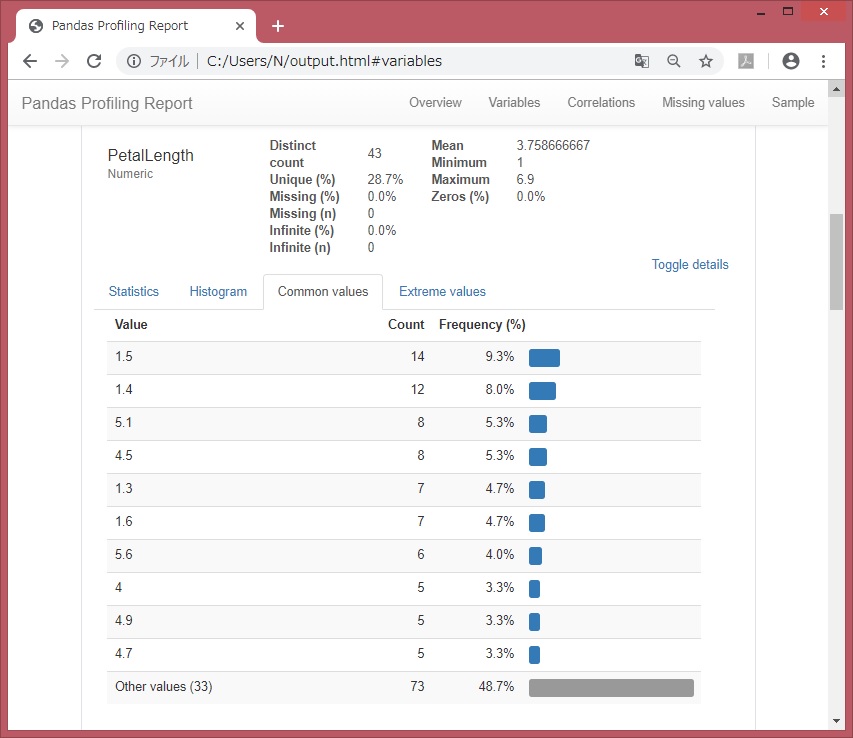
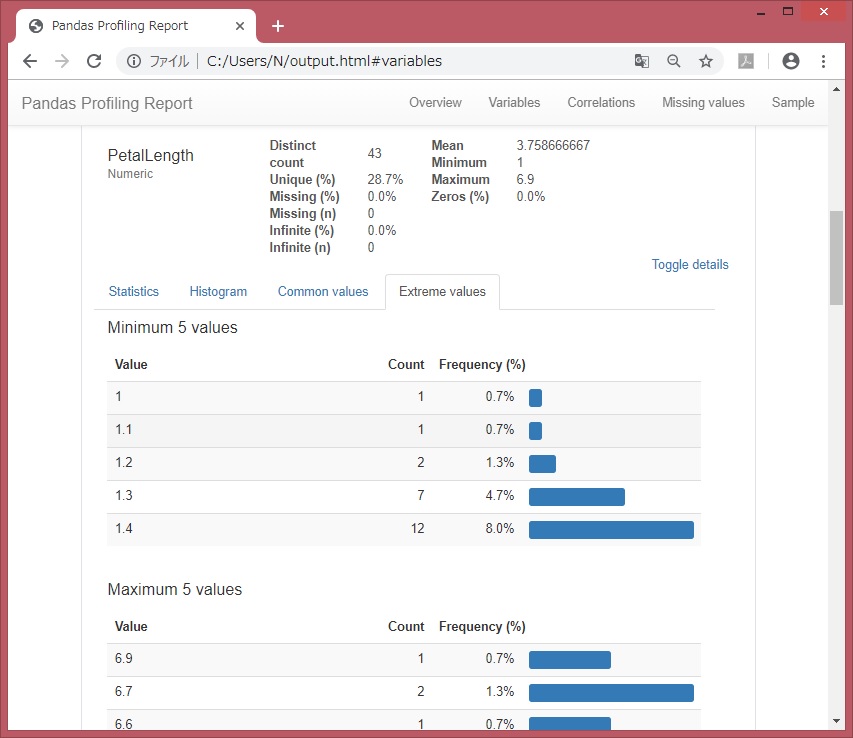
変数:Variables
df.describe()も可視化されてみえます。
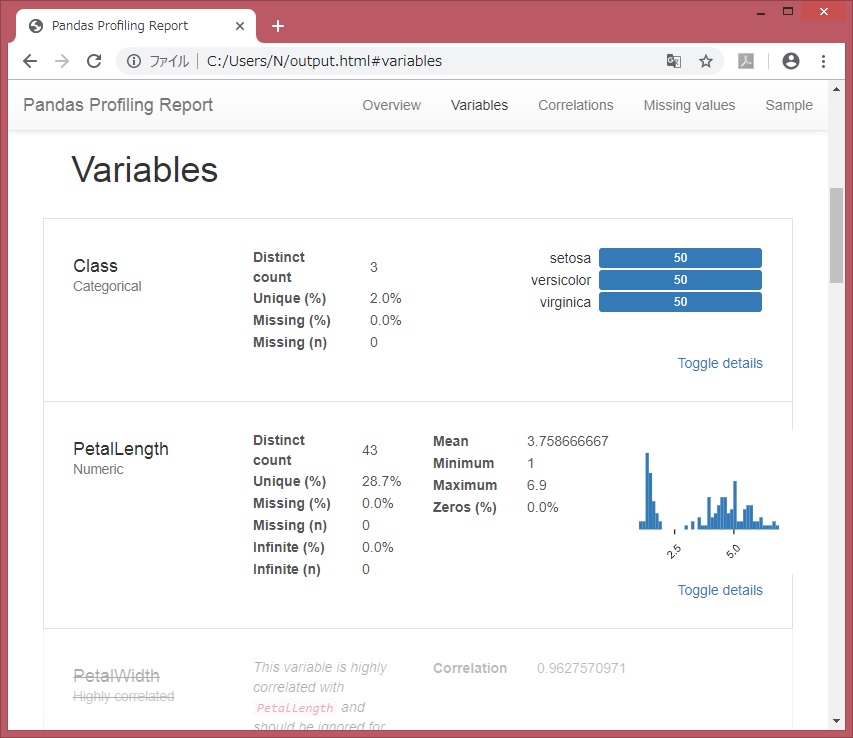
各変数のデータ値ごとの件数など。df[‘列名’].value_counts(dropna=False)に近い。
相関:Correlations
手持ちデータを、手軽に概観できそうです。